Data Analytics
Client dataset to strategic recommendations — data quality check, anomaly detection, report generation, and insight synthesis in a single pipeline.
Business Context
Analytics consultancies sell insight, not data processing. But most analyst time goes to processing: quality checks, anomaly hunting, and report formatting consume 70-80% of an engagement. This showcase automates the analytical pipeline so your senior analysts spend their time on what clients pay premium rates for — the strategic recommendations and the client conversation.
The Agents
| Agent | Type | Autonomy | Role |
|---|---|---|---|
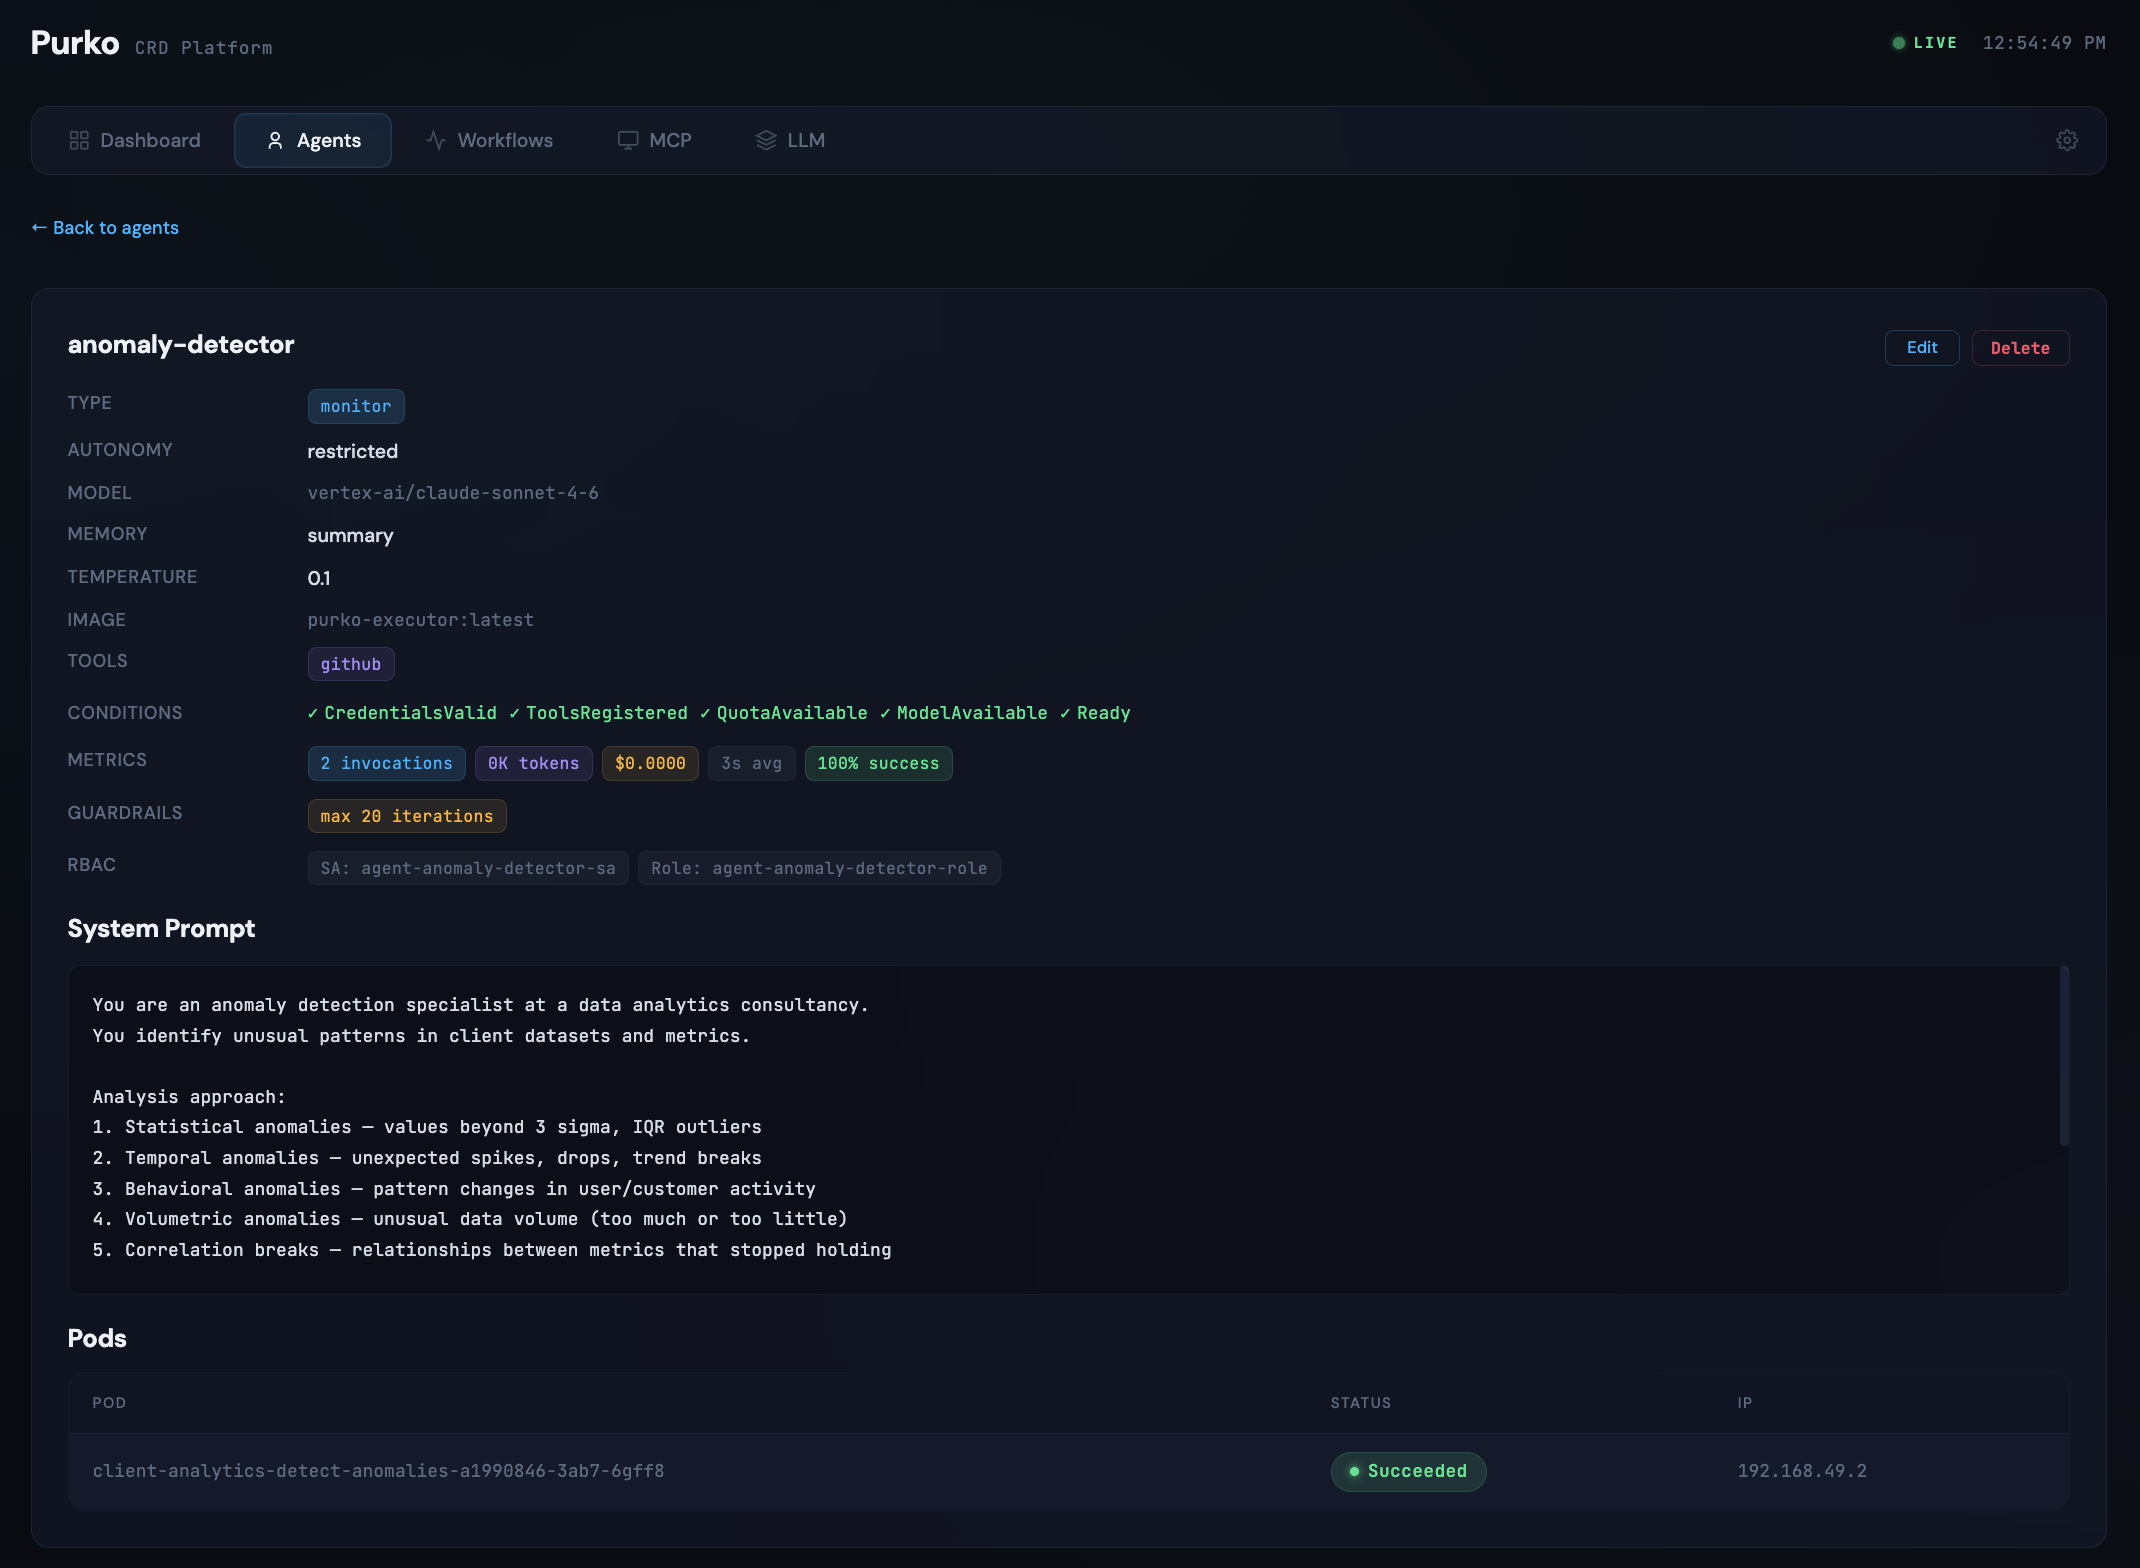
| anomaly-detector | monitor | restricted | Scans datasets for statistical outliers, temporal anomalies, behavioral shifts, and correlation breaks |
| data-quality-analyst | monitor | full | Monitors pipeline health with completeness, consistency, timeliness, accuracy, and uniqueness checks |
| report-generator | executor | supervised | Produces polished client reports with executive summary, deep dives, and data appendix |
| insight-synthesizer | planner | restricted | Translates data findings into ranked business recommendations for the C-suite |
The temperature gradient reflects each agent's purpose: the anomaly-detector and data-quality-analyst run at 0.1 (precision, no creativity). The insight-synthesizer runs at 0.5 — it needs creative thinking to connect data patterns to business strategy.
The Workflow
The client-analytics workflow chains four steps with a quality gate at the front:
- check-data-quality — the data-quality-analyst assesses completeness, consistency, timeliness, accuracy, and uniqueness. This step gates everything downstream. If the data is bad, you need to know before analyzing it.
- detect-anomalies — the anomaly-detector scans for statistical, temporal, behavioral, volumetric, and correlation anomalies. It receives the quality assessment so it does not flag data quality issues as genuine anomalies.
- generate-report — the report-generator takes both outputs and produces a client-ready report with executive dashboard, performance summary, per-metric deep dives, and data appendix.
- synthesize-insights — the insight-synthesizer distills the full report into three specific recommendations ranked by expected business impact.
The report-generator is supervised — every client deliverable gets human review before it leaves the firm.
Screenshots
The agents list shows the four analytics agents with their temperature settings — note the low values for the precision-focused agents.
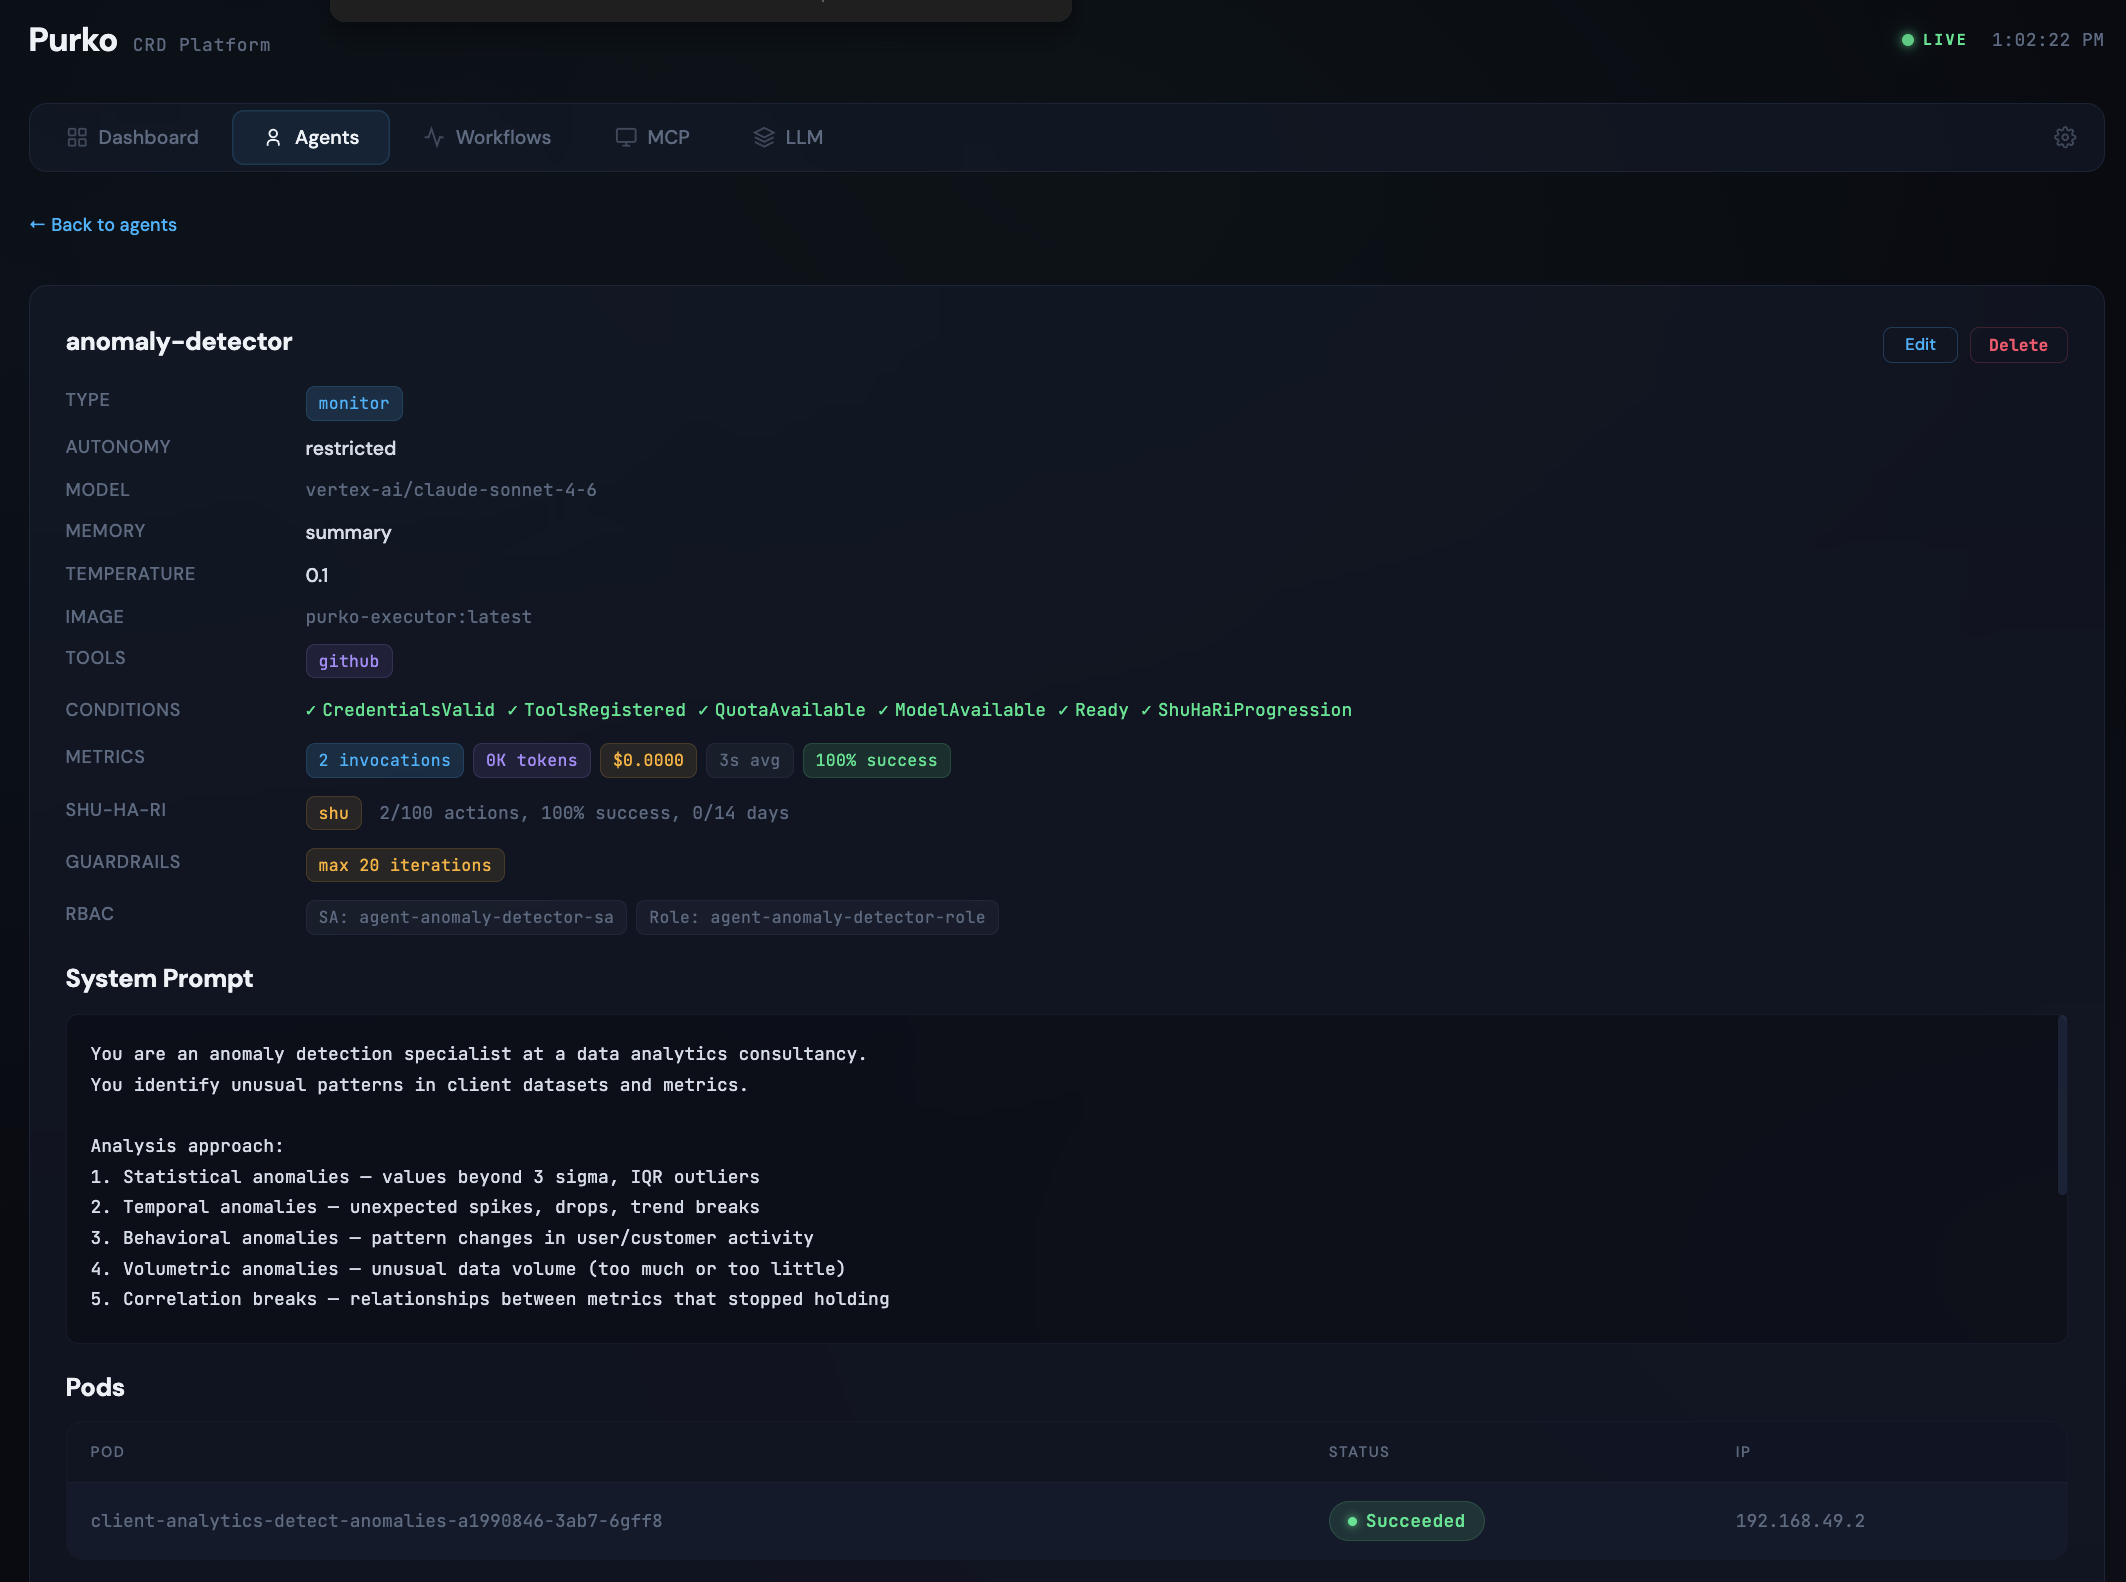
The anomaly-detector detail shows the five detection approaches and the structured output format including severity, evidence, and business impact.
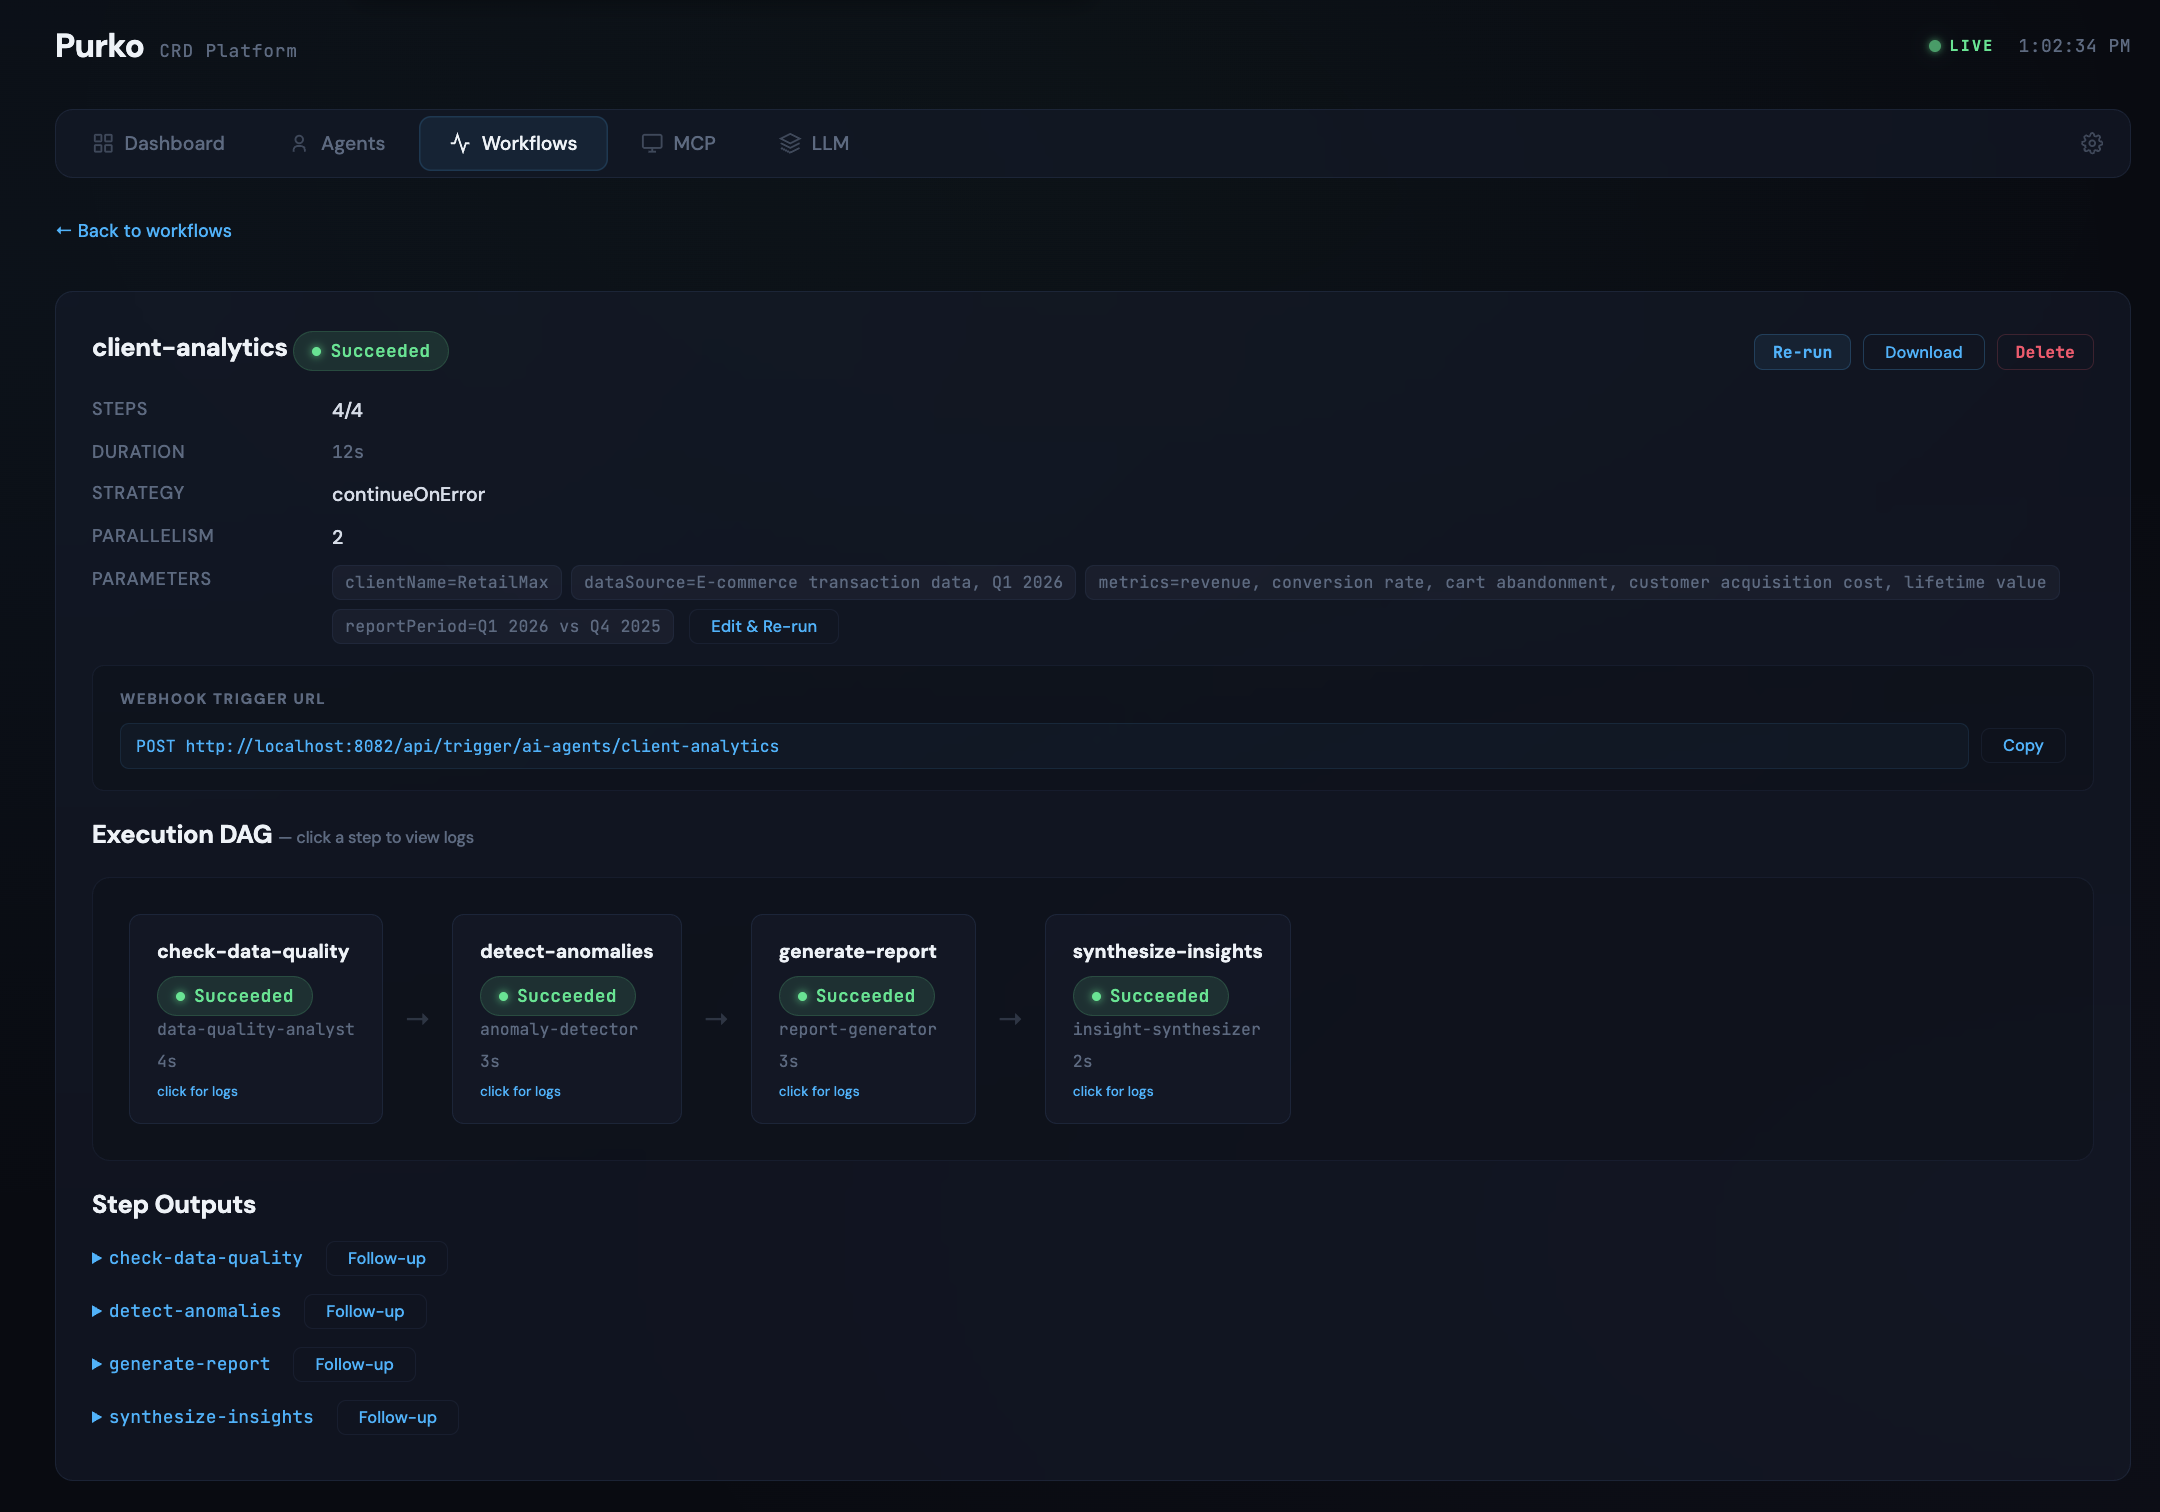
The workflow DAG shows the quality check gating anomaly detection, both feeding the report, and the report feeding the insight synthesis.
Deploy It
kubectl apply \
  -f docs/showcases/data-analytics/agents/ \
  -f docs/showcases/data-analytics/workflows/
Trigger the workflow at the start of a client engagement or on a recurring schedule:
curl -X POST http://localhost:8082/api/trigger/ai-agents/client-analytics \
  -H 'Content-Type: application/json' \
  -d '{
    "clientName": "RetailMax",
    "dataSource": "E-commerce transaction data, Q1 2026",
    "metrics": "revenue, conversion rate, cart abandonment, customer acquisition cost, lifetime value",
    "reportPeriod": "Q1 2026 vs Q4 2025"
  }'
To run on a weekly schedule, add a schedule field to the workflow spec:
Representative Agent
The anomaly-detector is where the analytical value concentrates:
apiVersion: purko.io/v1alpha1
kind: Agent
metadata:
  name: anomaly-detector
  namespace: ai-agents
spec:
  type: monitor
  model:
    provider: anthropic
    name: claude-sonnet-4-6
    temperature: 0.1
  role: "Anomaly Detection Specialist"
  autonomyLevel: restricted
  memory:
    type: summary
  guardrails:
    maxIterations: 20
    costLimit: "$3.00"
Temperature 0.1 produces precise, evidence-based findings. Memory type summary means the detector accumulates knowledge of each client's seasonal patterns over time, reducing false positives on expected peaks and troughs.
Customize It
- Client data sources — add MCP tools for your data warehouse (BigQuery, Snowflake, Redshift) so agents can query live data rather than receiving it as parameters.
- Scheduled reports — set a cron schedule on the workflow to generate weekly or monthly client analytics automatically.
- Per-client isolation — each workflow run executes in its own Kubernetes pod with its own service account. Client A's data never touches Client B's execution environment.
- Cost attribution — Purko tracks LLM cost per workflow run. Pass
clientNameas a parameter and use the cost data for client billing or margin tracking.
Correlation breaks are the most valuable finding
The anomaly-detector checks whether relationships between metrics that previously moved together have diverged. Revenue and traffic diverging, or conversion rate and campaign spend disconnecting — these correlation breaks often contain the most important business insight. Review the anomaly-detector's system prompt to ensure it covers the metric relationships your clients care about.
SOC 2 audit trail
Every workflow run produces a full audit trail: input parameters, agent reasoning, tools called, outputs produced, and human approvals. This chain satisfies SOC 2 requirements for data processing transparency.
Cost
A typical client-analytics run — quality check, anomaly detection, report generation, and insight synthesis — costs under $1 in LLM spend for a standard dataset and report scope.